Mercaux
Retail has always been a data-driven industry, but with advances in technology the emphasis on data is ever-increasing. The challenges faced by modern retailers demand a data-first solution, one that provides rich analytics and actionable insights for retailers to drive improvements to their bottom-line.
At Mercaux, our mission of helping retailers to transform the shopping experience, while simultaneously realising a sales uplift, can only be achieved if they are given the tools they need to understand the true impact of in-store technology. This is why Mercaux has a comprehensive analytics dashboard in our web-based portal as standard, giving HQ staff visibility across the entire estate of connected stores. Rather than purchasing an analytics solution from a third-party provider, we built a bespoke solution, so it is suited specifically to the needs of our retail customers. Read on to learn about some of the benefits of the Mercaux analytics dashboard.
 Making Analytics Actionable
Collecting a wealth of store data is only useful if it facilitates a clear understanding of the actual day-to-day events in stores. Both Head Office and Store Managers need specific insights that turn meaningless archives of data into reports that can be actioned to drive business critical metrics, such as:
- Increase in conversion
- Increase in units per transaction (UPT)
- Increase in overall sales
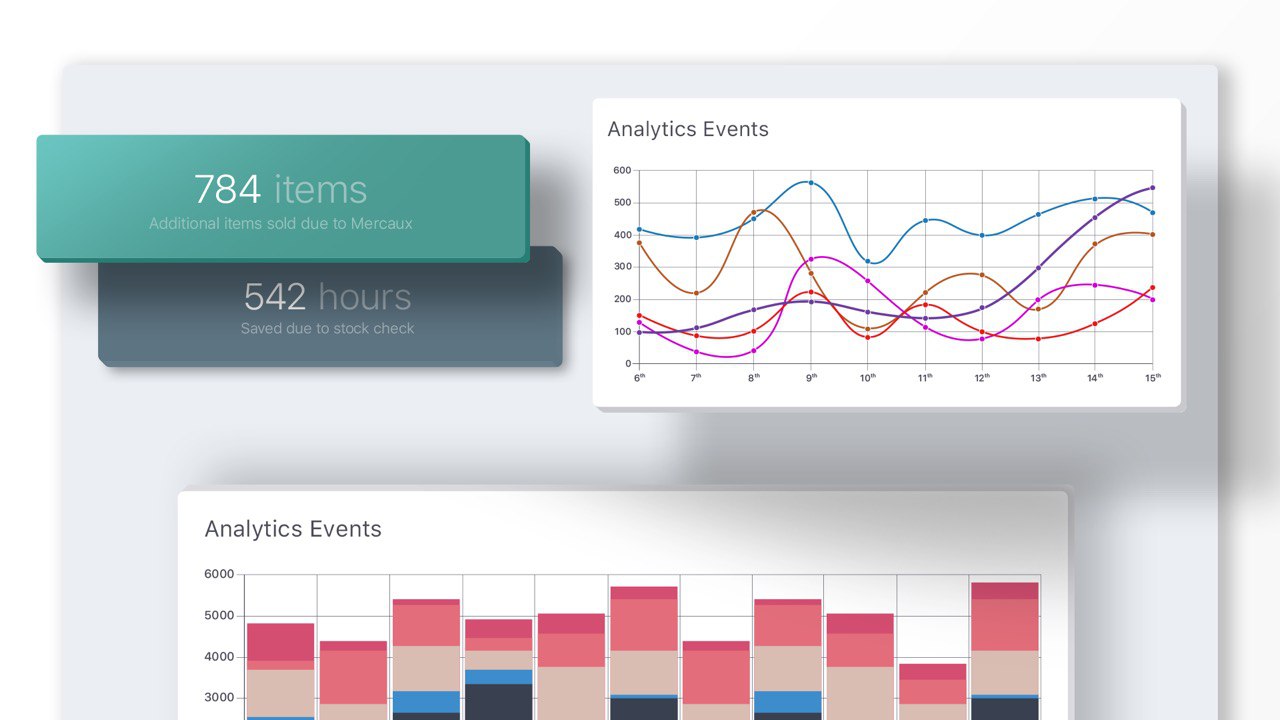
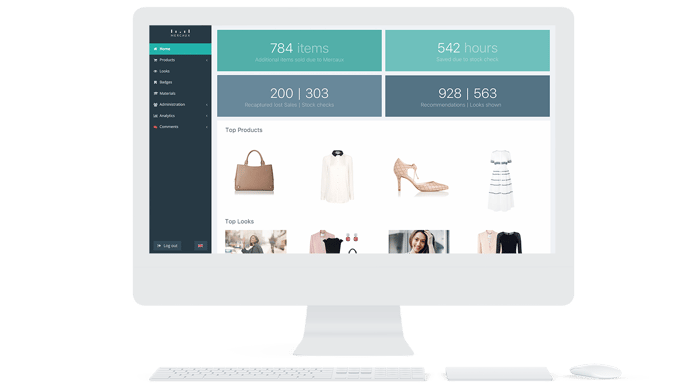
When logging into the Mercaux web-portal, the first thing that users will see is the dashboard, which gives them the most important information they need at a single glance. Key performance metrics, like the number of additional items sold, lost sales recaptured, online orders placed, recommendations given and looks shown, are displayed front-and-centre. Each of these are derived from live usage activity, which can be seen by selecting Analytics from the menu on the left-hand side. From the total number of stock checks and the average time saved with each check, we arrive at the total productivity impact of Sales Assist, for example.
This data has implications for Store Managers across different trading periods. During the sale period, Store Managers might encourage Sales Assistants to increase the number of stock checks for customers, increasing conversion and helping them to find the items they like even where availability is limited. As the new seasons’ collection arrives, Store Managers might instead encourage Sales Associates to build new looks, or present the new collection via the in-app catalogue, increasing UPT by encouraging customers to buy complete looks instead of single products.
Take a Deep Dive into Specific Events
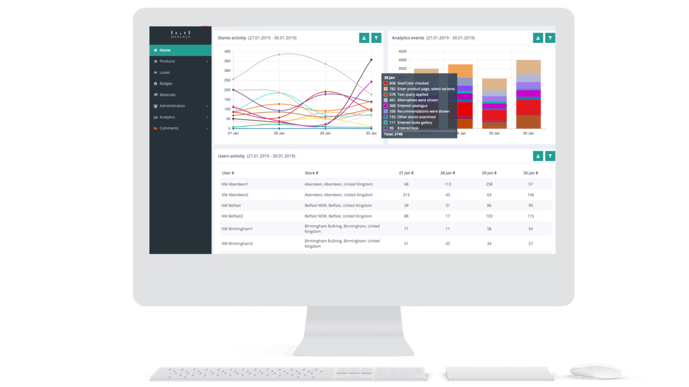
The activity dashboard gives a snapshot of real-time usage activity across the entire network of stores. Actions in-store are known as “events”, and there is a countless number of events that can be tracked. Colour-coded graphs track store activity, giving an understanding of performance over time so that trends and patterns can be easily identified. Stores and users can be benchmarked against one another to praise superstar stores and identify others that may need more encouragement to use the app to reap the benefits. Analytics can even be used to monitor and enforce access to important materials like visual merchandising and training guides, as viewing activity is timed and reported on a user-level basis.
If Head Office is interested in a particular event, like the number of baskets e-mailed or the number of times the catalogue was opened, the raw data can be filtered to show specific events across a variable time period. The web-portal can generate a custom PDF analytics report, showing the selected events in all stores, or for a particular store cluster, across the selected time period. Alternatively, the raw data can be exported as a CSV file, giving the flexibility for analysis using external software.
Understanding the Product Funnel
Get to know your customers’ preferences better than ever with product analytics. While it was previously difficult to gauge the product interest of customers browsing in-store, product analytics data brings ecommerce-level analytics to physical stores. Store Associates know customers better than anybody, but using Mercaux Head Office gain full visibility of customer behaviour at store-level.
The number of times a product is viewed from the catalogue, incorporated into a look, or viewed as part of a look, is all recorded and reported live. The most popular products and styled products each season, as well as the sizes that are most often requested, but are frequently out of stock, can give insights to help future merchandising and stock planning. Conversion can be tracked, making it easy to identify products with a lot of interactions in-store, but lower sales than expected. Merchandising can investigate this immediately through the Mercaux Store Operations solution, communicating directly with Store Associates for product feedback to inform future product decisions. Such granular insight into the sales process would be challenging, if not impossible, without Mercaux.
The Mercaux web portal and its integrated analytics dashboard make it easy for retailers to gain full visibility of store activity, a key aspect of creating the ‘store of the future’. The solution is part of Mercaux’s Head Office Management Product. If you would like to learn more about the Mercaux analytics dashboard, or any of our other features, please contact us.