
Erika Kirichenko
Data Analyst
Building a digital transformation roadmap is high on the agenda of many retail executives. In fact, McKinsey highlighted 'digital' amongst 5 critical areas of focus in their latest study and stated that "Retailers must act now, not only to keep pace but also to thrive in new market conditions."
With digital transformation a key component of retail's recovery, and a catalyst for thriving in future market conditions, it should be crystal clear how this contribution is achieved in actuality – how is the business benefiting from this digital investment, how is the customers' experience being enhanced and what does the return on investment look like? Ultimately, are these investments bettering our business critical KPIs?
This is a question frequently asked to us at Mercaux, and is why we've put together this short guide into how we measure and prove the the success of our in-store digital transformation solutions:
Before we look at these success metrics in a bit more detail, let me first introduce myself. I'm Erika Kirichenko, one of Mercaux's Data Analysts, and as I will go on to explain, part of my responsibility is to provide our customers with the tools and analyses they need to measure the impact of Mercaux's in-store solutions.
- Like-for-Like Comparison
This is the most straightforward way to measure the impact of Mercaux as it compares KPIs between stores that have deployed the solutions (Trial group) and those stores that have not (Control group). To strengthen this comparison, we ensure that the Trial and Control stores are matched on similar features such as size, location and layout, and, on top of this, we conduct a year-on-year comparison with results collected the previous year to see if there has been any seasonal changes that may impact the results.
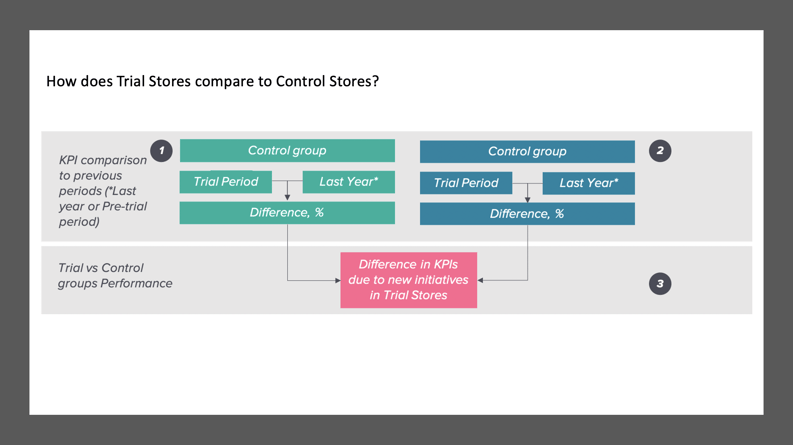
The like-for-like comparison investigates whether Trial stores perform better than Control stores across certain KPIs. Based on our previous analysis and experience working across multiple pilot campaigns, we believe that the value of Mercaux’s in-store technology is best analysed by measuring:
- Customer conversion rates (CVR)
- The number of units per transaction (UPT)
- The average order value (AOV)
Rather than measure the impact of Mercaux technology on total sales figures, we look at these 'weighted' indicators as the best reflection of the impact of our tools in-store. Mercaux technology is not necessarily designed to increase store traffic; instead, our technology is deployed to generate a sales uplift by increasing the conversion rate amongst customers who have already entered the store. We focus on measuring conversion rates in a customer’s path to purchase because, irrespective of total sales figures, your in-store technology could still be adding significant value to your business, for example by increasing the average order value or the number of units per transaction.
Simply put, by using Mercaux, there are more customers in your store completing a transaction, and those transactions (baskets) contain more items and are on average higher in value.
Once we have looked at all the data, if the Trial group indicators grew more in the Trial period than in the pre-Trial period, and if they grew more than in the Control group, then we can consider the pilot to be a success.
- Correlation Analysis
Correlation analysis allows us to evaluate if there is a direct link between certain KPIs (conversion for example) and use of the Mercaux app, relative to traffic. In order to calculate correlation analysis, we use data collected from both retail stores and the Mercaux App.
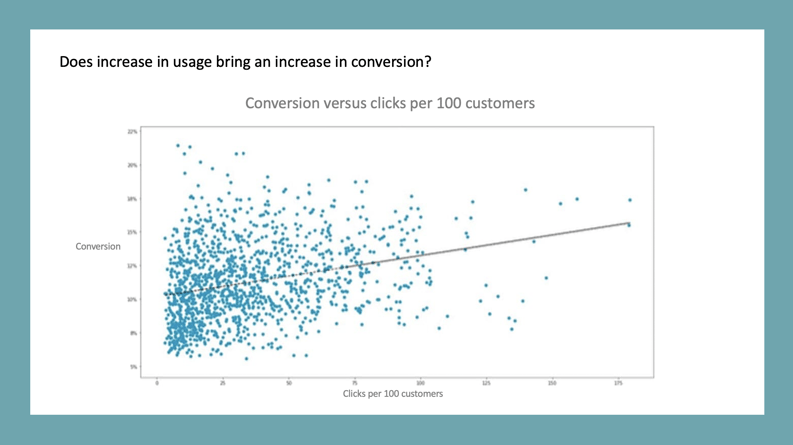
As an example, if we wanted to measure the relationship between conversion and usage of the Mercaux app, then we would analyse the following data:
Data from a specific store
- Store footfall & number of transactions;
Data from the App
- Number of ‘main events’ from the App – these include intent to buy signals such as, entering the product catalogue, checking product availability, applying filters, adding items to basket etc.
Using these two pools of data, we are able to measure the correlation between app engagement and customer conversion (or other KPIs, such as UPT or AOV). Depending on the KPI we want to investigate, we adjust the data input accordingly: for example, to measure correlation between app usage and AOV, we would collect daily sales data from the retailer, including the number of items sold per store and the number of units per transaction.
Our correlation analysis measures app usage relative to traffic against a chosen KPI. If we can see that the KPI has increased with higher usage of the App, then we can consider this a positive correlation. How does this analysis work in practice? To put this into a bit more context, our analysis proved that one of our clients, a UK-based fashion retailer, achieved an average uplift in conversion of 6% when using our app - in this instance, the data for conversion and app usage per footfall showed that, the more they used the app, the higher their customer conversion rate became.
- Direct Sales Analysis
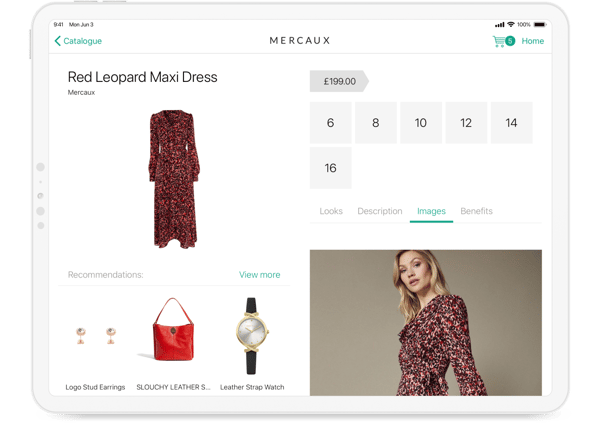
Direct sales analysis goes one step further than correlation analysis by showing which sales events can be linked to specific activity in the Mercaux app.
A direct sale is recorded when we can link an "event" in the Mercaux app to a purchase made through the point of sale (POS) – the event in the App and subsequent purchase must have happened in the same store within a given time frame (e.g. 30 or 60 mins). To put this in context, if a Sales Associate showed a customer the product page for a Red Leopard Maxi Dress, and, within half an hour, that dress was passed through the POS, then this would be attributed in some part to Mercaux.
It is worth noting that we adjust our direct sales analysis to take into consideration the number of direct sales that occur by chance – this is particularly important for retailers with a low number of SKUs, where the possibility of a ‘random direct sale event’ is quite high.
- Omnichannel Sales Analysis
In addition to driving direct sales, Mercaux’s in-store technology also drives incremental sales through omnichannel orders. For example, when a direct sale is not possible because a product is unavailable, Mercaux's Sales Assist and Omnichannel function enables Store Associates to either recommend an alternative product or to locate that product somewhere else in the retailer’s estate to purchase - click and collect in another store, transfer the basket online to purchase through eCommerce or email the basket to the customer to complete the transaction at a later date.
Through simple tracking, these orders can be traced back to the point of origin in the Mercaux App where it can be attributed to an omnichannel purchase.
We hope you found this article useful in demonstrating how we provide our customers with the tools they need to track the performance of Mercaux and the impact it has on business critical KPIs.
In addition to providing our customers with the tools they need to measure the impact Mercaux has on their business, we also unlock a whole new set of customer, staff and product data to help improve the in-store shopping experience. Visit our Analytics page here to learn more.