

David Miller
Chief Marketing Officer
We’ve been supporting retailers during store closures over the past few months to consider how they plan on responding, recovering and reimagining the retail landscape post-crisis (see our resource centre here).
As the world of retail finally reopens their stores in an uncertain time being dubbed the “new normal”, our focus now turns to providing our retail colleagues with short and long-term strategies for accelerating the speed of recovery in these stores.
For a lot of retailers, these stores will inevitably open with a leaner team from store-level, up to HQ. So, what initiatives can we deploy to recover quickly without all “hands on deck”. One response that can fundamentally change the trajectory of your recovery is prising open the black box of in-store data.
Using data to make informed (and a lot of times automated) decisions is second nature to our colleagues in eCommerce teams, so why should brick-and-mortar be any different? When you consider physical retailing, just how much of a data-driven retailer are you? We conducted a webinar on the subject on this post, the recording of which can be found at the bottom of this page.
1. The path to becoming a data-driven retailer
To become a data-driven retailer, we must first understand what existing company-wide data we have to leverage, and what new data we want to capture. Produce a simple list of all the data points you want to use and conduct an audit to see how far you need to travel to become truly data-driven in your stores (our CTO wrote a post on this here). Here’s a few examples:
1.1 Leveraging existing data and insights in-store
Most retailers have the following data streams, but are not utilising them in-store:
- Productivity Data: Stock & Inventory Information and Availability
- Omnichannel Sales Data: Online availability of your products
- Personalisation Data: A 360 view of your customers’ engagement with your brand from your CRM system
1.2 Capturing brand new in-store data
From a customer entering the store through to a purchase ringing through the tills (or not), retailers are faced with a black box of potential data points that would reveal exactly what has happened in a customer’s path to purchase that influences that sale, or lost sale. We call this, the black box:
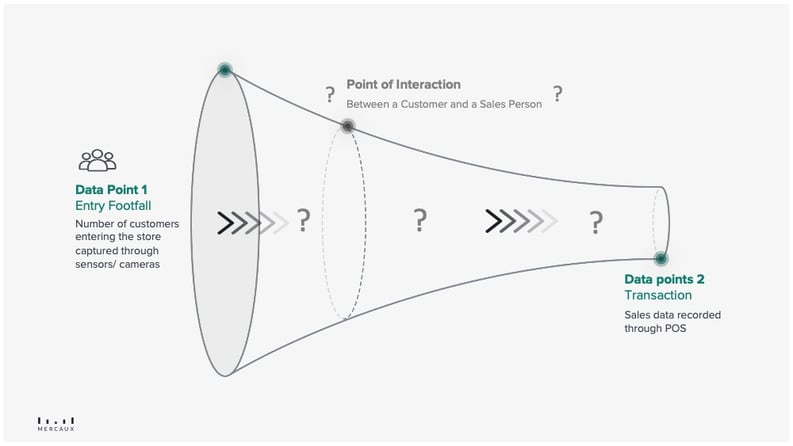
Think “outside the box” of what data streams you would include in your wishlist to help you understand what affects the path-to-purchase, whether you believe you can obtain these feeds or not - you might be surprised. We have three in-store data feeds that we believe will be key in helping you understand what is happening in-store, so that you are able to vastly improve performance of your stores:
 |
Customer behaviour |
 |
Product funnel What are the most popular products that customers have engaged with pre-purchase/ pre-lost sales? |
 |
Staff behaviour What is their level of engagement from staff and are they inspiring your customers to purchase your products? |
Getting this valuable data into the hands of your sales staff should be the focus of any CIO/ CTO/ Retail Executive. The quicker this is done, the sooner that your staff can utlise it to improve the in-store experience to ultimately increase conversion in the short-term, and customer LTV in the long.
2. Data Collection
How exactly do you go about collecting this illusive data? Let’s spend a bit of time understanding what insights can be collected and crucially, how:
2.1 Customer Behavioural Data
Examples of insights:
- In-store Products Preferences
- In-store “journey” (e.g., engaged with 10 products, purchased 1)
- Client-specific Insights (notes) to enrich CRM profile
- Offline to online conversion
Data collection example:
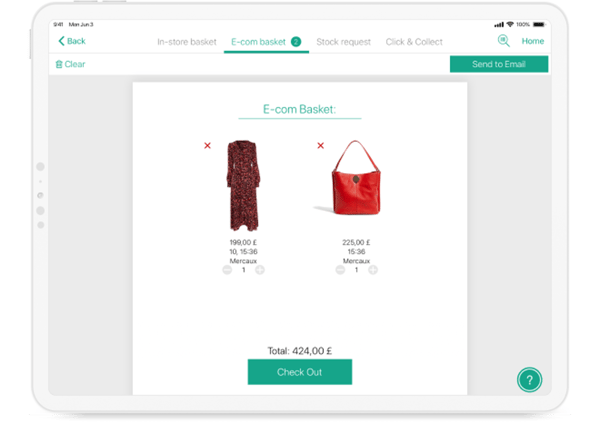
In addition to the Sales Assist Solution (see product funnel example below) that can attribute search attributes to a specific person, or amalgamated together to understand trends across stores, the true value for an individual customer comes when your staff are able to access data about that specific customer to offer a personalised experience. Accessing a customer’s previous engagement with your brand (both online and offline) gives your sales team the tools to recommend products or entire looks that have been curated especially for them. The Clienteling Solution not only uses previous transactional data, but also encompasses online wish lists and behaviours/preferences collected by staff in previous visits.
If customers are unwilling to reenter stores after the lockdown, the solution allows your staff to communicate with them from store to offer a remote personalised service via email.
Clienteling: Provide your Sales Associates with a view of your customers' engagement across all channels
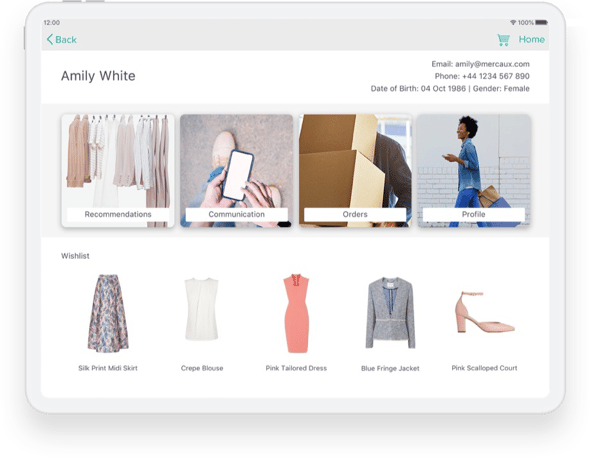
Omnichannel: Offline to online conversion data
2.2. Product Funnel Data
Examples of insights:
- Popular Products
- Lost Sales (e.g., if size is requested, but not available)
- Conversion of particular product Alternatives and Recommendations
- Popular Colours
- Popular Bundles / Looks
Data collection example:
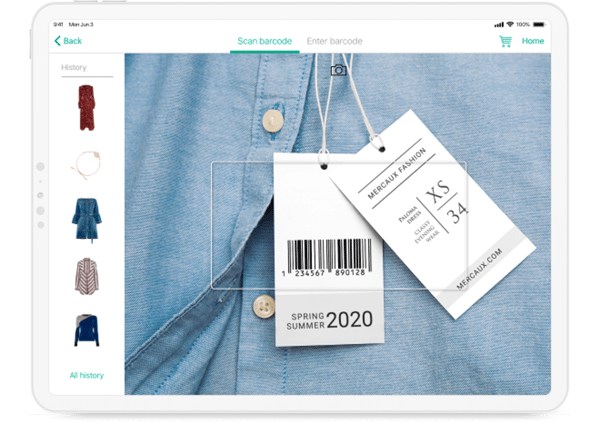
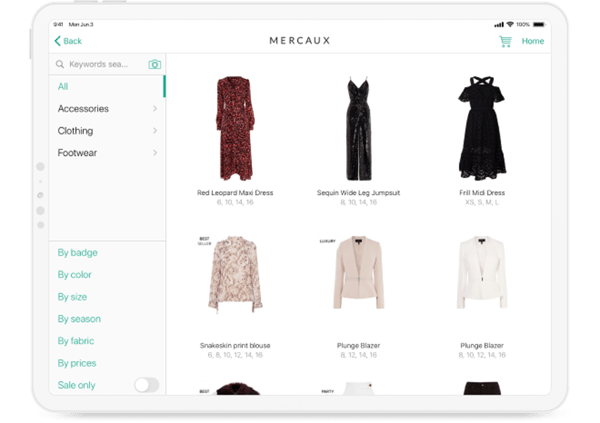
The Sales Assist Solution, with its scan & search functionality, collects data on every product enquiry (e.g. size availability check), or product attribute (e.g. skirts in red), so you can understand the most popular requests in-store. Use this data to understand the most popular products requested, and not just the available ones that pass through the till. An incredibly important metric to understand if you need to address distribution and fulfillment issues.
Sales Assist: Scan a Barcode
Sales Assist: Catalogue Search
2.3 Staff Behavioural Data
Examples of insights:
- Level of Engagement with Customers (e.g., vs. Footfall)
- Scenarios with Customers (e.g., does this Sales Person offer looks or recommendations)
Data collection example:
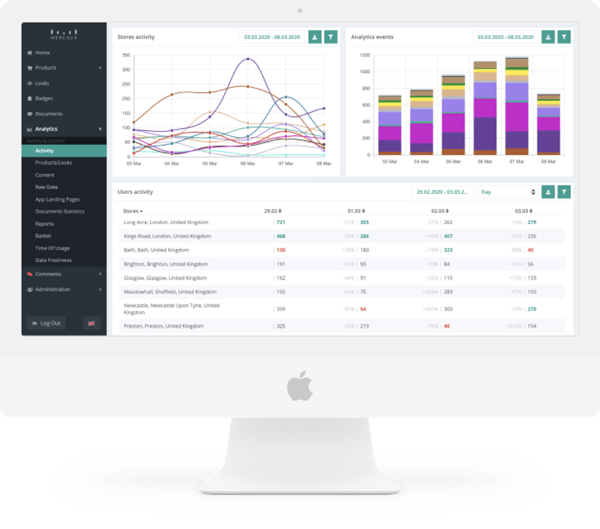
By giving your staff digital tools to help them serve and sell smarter, you are also giving yourself (at a HQ leve) the data you need to measure the effectiveness of your staff. With every tap of the screen, data is collected and analysed instantly by the powerful Analytics Tool in the Mercaux Platform so HQ teams can compare performance between staff or stores.
Arrange for peer-to-peer training to improve weaker areas for specific staff or set weekly targets to push the actions you know will improve conversion, basket size or LTV, such as pushing looks, collecting email addresses or offering alternatives if a size is not available.
Mercaux Analytics Dashboard: Understanding Sales Associate behaviour
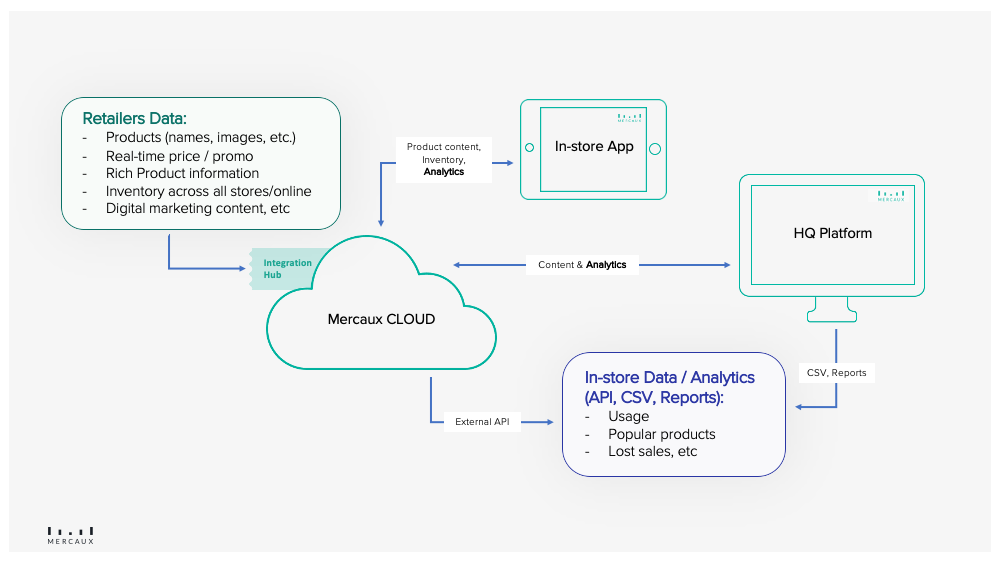
Interested to understand how the flow of data works? Here’s a simple flowchart for those with a technical mindset:
3. Using insights to improve the customer experience
By putting these insights into the hands of your sales associates, you are helping them to serve the customer quicker, smarter and in a more personalised way, resulting in more transactions and bigger basket sizes passing through your POS or OMS.
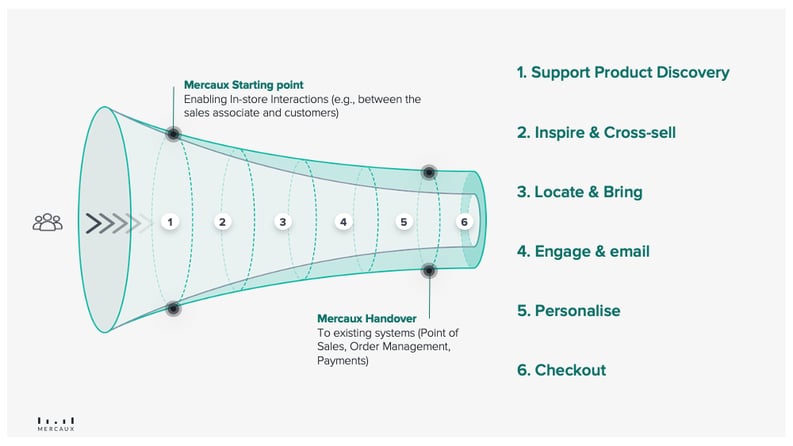
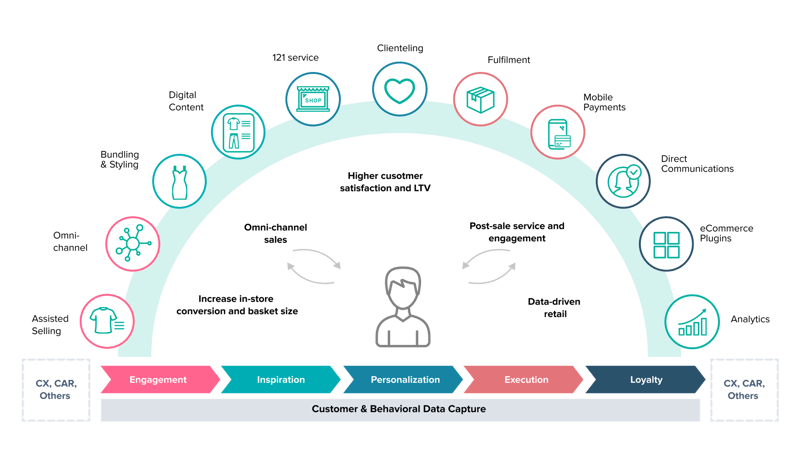
Mercaux’s solutions support retailers at all stages of a customer’s path-to-purchase from initial engagement, through to long term loyalty:
For more information on how the data collected in-store is analysed by HQ Teams, visit our Analytics page here.
We held a webinar in collaboration with EY to discuss the retail black box. You can find the recording here: